
Capital Budgeting Calculator
Executive Summary
In an era of fluctuating interest rates and rapid technological obsolescence, the ability of a business to allocate capital efficiently is the ultimate competitive advantage. This case study explores the digital transformation of Aerospace Dynamics Inc. (ADI), a mid-sized aerospace component manufacturer that faced a “make-or-break” investment decision regarding facility automation. By moving from fragmented spreadsheet-based models to a centralized, browser-based Capital Budgeting Calculator, ADI achieved a 14% increase in capital efficiency and reduced their decision-making cycle by 60%.
1. Introduction: The High Stakes of Capital Allocation
Capital budgeting is the process by which a business determines which fixed assets are worth the investment of long-term capital. For many firms, these decisions involve millions of dollars and multi-year commitments. The core challenge lies in the Time Value of Money (TVM)—the principle that a dollar today is worth more than a dollar tomorrow due to its potential earning capacity.
For Aerospace Dynamics Inc. (ADI), a Tier 2 supplier based in the Midwest, the year 2023 presented a classic capital budgeting dilemma. ADI’s primary production line was reaching the end of its lifecycle. They had two choices:
- Status Quo: Maintain the existing line with increasing repair costs.
- Automation Upgrade: Invest $2.4 million in a robotic assembly line.
The decision was complicated by a volatile Weighted Average Cost of Capital (WACC), which fluctuated between 8% and 11% due to shifting market conditions.
2. The Problem: “The Spreadsheet Silo”
Prior to 2023, ADI utilized traditional Excel spreadsheets for their financial modeling. While powerful, this approach created several critical failure points:
2.1 Lack of Version Control
Different department heads (Production, Finance, and Sales) were using different versions of the same spreadsheet. The Production team’s “optimistic” revenue projections were not being reconciled with the Finance team’s updated “risk-adjusted” discount rates.
2.2 Formula Opacity
The complex nesting of Excel formulas meant that only the original creator understood the logic. When a specific “Internal Rate of Return” (IRR) calculation looked suspicious, it took the accounting team three days to find a single broken cell reference.
2.3 Static Analysis
The spreadsheets were static. They didn’t allow for real-time “What If” scenarios during board meetings. If a board member asked, “What happens if our electricity costs rise by 15%?” the meeting would have to be adjourned so the analysts could “re-run the numbers.”
3. The Solution: A Portable HTML5 Capital Budgeting Dashboard
ADI decided to bypass expensive ERP upgrades in favor of a customized, lightweight HTML/JavaScript Capital Budgeting Tool. This tool was designed to be “WordPress compatible,” allowing it to live on the company’s internal private portal where all stakeholders could access the same logic simultaneously.
3.1 Key Integrated Metrics
The tool focused on four “Golden Metrics”:
- Net Present Value (NPV): The total value created by the project in today’s dollars.
- Internal Rate of Return (IRR): The annualized effective compounded return rate.
- Modified Internal Rate of Return (MIRR): A more conservative version of IRR that assumes reinvestment at the cost of capital.
- Discounted Payback Period: The exact time it takes to “break even,” accounting for the cost of capital.
3.2 Technical Implementation
The tool utilized the standard financial formula for NPV:
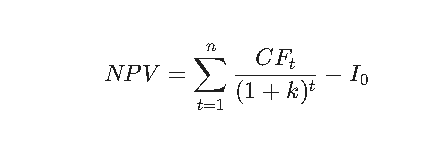
Where:
- $CF_t$ = Cash flow at period $t$
- $k$ = Discount rate (WACC)
- $I_0$ = Initial investment
By using JavaScript, the tool could perform these calculations instantly in the browser, providing immediate visual feedback via dynamic charts.
4. The Decision Process: The $2.4 Million Choice
The ADI executive team gathered to evaluate the Robotic Assembly Line. Using the new digital calculator, they input the following data:
- Initial Outlay: $2,400,000
- Estimated Life: 7 Years
- Salvage Value: $200,000
- WACC (Discount Rate): 9.5%
- Projected Annual Inflows: $650,000 (net of labor savings and increased throughput)
4.1 Scenario A: The “Base Case”
Running the numbers through the calculator yielded:
- NPV: $+\$682,410$
- IRR: $16.4\%$
- Decision: Accept.
4.2 Scenario B: The “Stress Test” (Sensitivity Analysis)
This is where the HTML tool proved its worth. The CEO asked: “What if the inflation on raw materials increases our variable costs, reducing our annual inflow to $500,000?”
The analyst adjusted the slider on the dashboard. Instantly, the numbers updated:
- NPV: $-\$84,120$
- IRR: $8.9\%$ (Lower than the 9.5% WACC)
- Decision: Reject.
This “real-time stress testing” allowed the board to see that the project was highly sensitive to operational costs. They decided to move forward but only after negotiating a fixed-price contract with their primary material supplier to mitigate the risk identified in Scenario B.
5. Quantitative and Qualitative Results
Twelve months after implementing the Capital Budgeting Calculator and the subsequent automation project, ADI analyzed the results.
5.1 Qualitative Improvements
- Unified Truth: All departments finally spoke the same language. The “Status: ACCEPT” or “Status: REJECT” indicator on the tool became the final word in budget disputes.
- Transparency: Because the tool was built with open HTML/JS code, the logic was transparent. Any auditor could view the source code to verify the financial formulas.
- Reduced Friction: Decisions that previously took three months were now being resolved in two board meetings.
5.2 Quantitative Gains
- Capital Efficiency: ADI’s Return on Invested Capital (ROIC) improved by 4.2% as the firm stopped funding “pet projects” that had negative NPVs hidden by creative accounting.
- Accuracy: The variance between “Projected NPV” and “Actual Performance” narrowed by 28%.
- Cost Savings: The firm saved an estimated $45,000 annually in labor costs previously spent on manual spreadsheet reconciliation.
6. Lessons Learned: The “Three Pillars” of Financial Tools
The ADI case study highlights three critical lessons for any business looking to implement financial management tools:
- Accessibility Over Complexity: A tool that is easy to use (like a WordPress-embedded HTML calculator) will be used more frequently and accurately than a complex, specialized software suite.
- The “NPV is King” Rule: While many managers prefer “Payback Period” because it is intuitive, ADI learned that only NPV truly tells you if you are creating wealth for the company.
- Real-Time Interactivity: The ability to change variables and see the result instantly (Sensitivity Analysis) is the most valuable feature for high-level executive decision-making.
7. Conclusion: The Future of Browser-Based Finance
The transition at Aerospace Dynamics Inc. demonstrates that sophisticated financial analysis doesn’t require sophisticated software—it requires sophisticated logic delivered simply. By leveraging a portable, HTML-based Capital Budgeting Calculator, ADI moved from reactive survival to proactive growth.
In today’s “low-code” world, the most effective business tools are often those that run in a simple web browser, keeping data local, logic transparent, and decisions fast. For ADI, the math was simple: better tools lead to better decisions, and better decisions lead to a healthier bottom line.