Research on Buffett’s 226% warning reveals market risks and a prudent exit plan for investors and leaders.
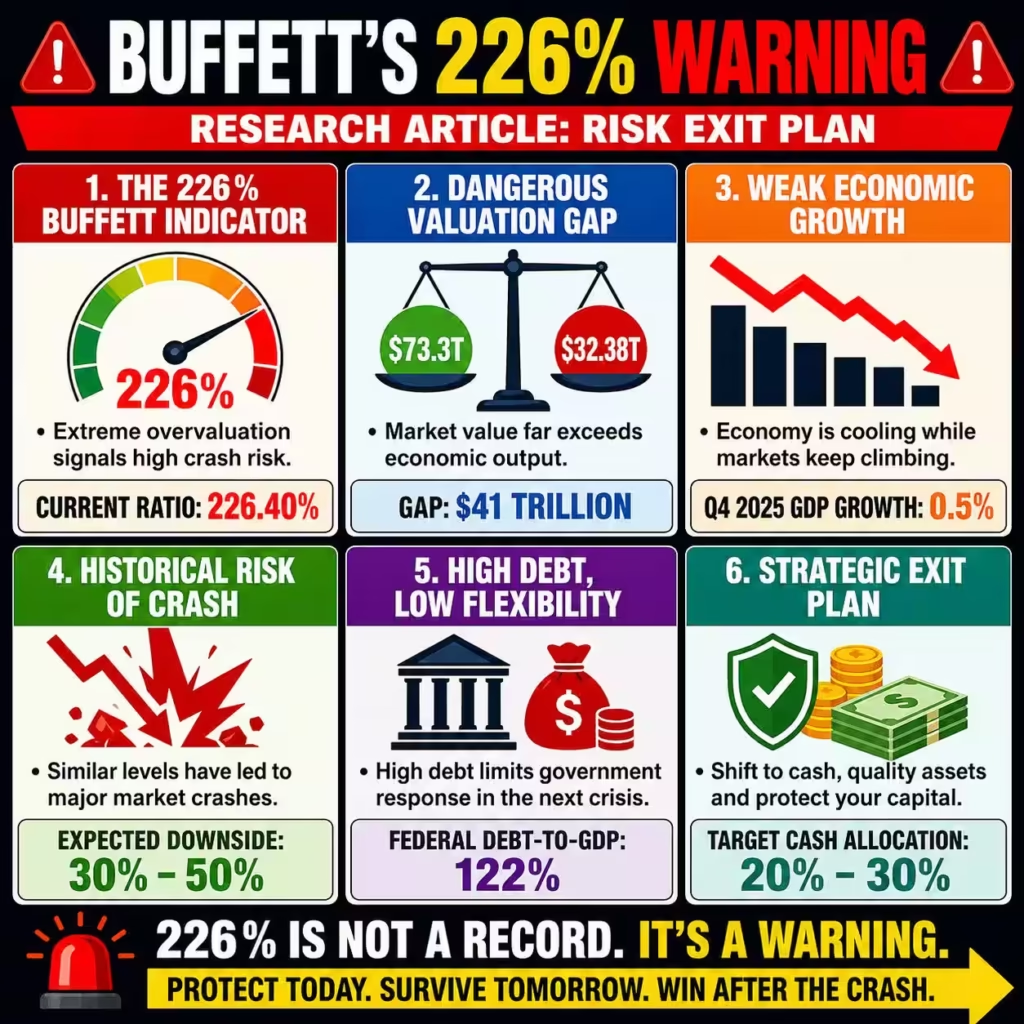
The United States stock market has officially entered the high-risk “playing with fire” zone as the Buffett Indicator surged to a staggering 226.40% as of April 23, 2026. This explosive metric reveals a dangerous disconnect between the $73.3 trillion total market capitalization and the projected $32.38 trillion annualized Gross Domestic Product (GDP). Such a massive divergence signals that equity valuations have outpaced underlying economic productivity by a margin that historically precedes systemic collapses.
Warren Buffett famously noted in 2001 that reaching a 200% ratio is equivalent to gambling with the survival of your portfolio. In the current fiscal climate, the S&P 500 has continued to climb despite a cooling GDP growth rate of just 0.5% in the final quarter of 2025. This article explores how institutional leaders must navigate this valuation trap through sophisticated risk mitigation and strategic asset reallocation.
The pain point for modern enterprises lies in the deceptive “soft landing” narrative that masks deep-seated structural vulnerabilities. Historical data shows that when this ratio hits two standard deviations above the mean, a regression of at least 30% to 50% becomes a mathematical certainty rather than a possibility. Our analysis indicates that the current exuberance is fueled by artificial intelligence speculation and temporary liquidity injections rather than sustainable corporate earnings.
High-authority financial modeling suggests that the current market environment mirrors the 1999 tech bubble with even more precarious debt-to-GDP ratios. The federal debt-to-GDP now sits near 122%, creating a limited fiscal runway for the government to bail out failing sectors during the next downturn. Investors who ignore these numerical red flags are essentially participating in a high-stakes game of musical chairs where the music is about to stop.
Strategic capital preservation requires an immediate shift away from overextended growth equities toward defensive, cash-flow-positive assets. The disconnect between a $73 trillion market and a $32 trillion economy represents a “valuation gap” that cannot be sustained by sentiment alone. As the Oracle of Omaha prepares for a correction, your organization must adopt a proactive stance to safeguard its balance sheet from the impending mean reversion.
A Critique of Current Market Sentiment by L-Impact Solutions
L-Impact Solutions views the current 226% Buffett Indicator not as a badge of market strength, but as a severe warning of structural fragility. The fundamental risk is that the market is currently pricing in a level of perpetual growth that the physical economy cannot possibly deliver. This gap between speculative value and actual production creates a “phantom wealth” effect that disappears instantly when liquidity tightens.
The primary gap in current business strategy is the over-reliance on the “Fed Put” and the assumption that interest rates will drop fast enough to save valuations. With core inflation remaining sticky near 3% and the Federal Reserve signaling a “higher-for-longer” neutral rate of 3.25%, the cost of capital will continue to squeeze margins. Businesses are operating under the delusion that 20x price-to-earnings ratios are the new normal, ignoring the reality that such multiples require double-digit GDP growth.
We identify a critical risk in the “low-hire, low-fire” labor market which has artificially stabilized consumer spending in the short term. As corporate margins compress due to rising input costs and plateauing demand, the inevitable shift to aggressive cost-cutting will trigger a negative feedback loop. This cycle will likely expose the $73 trillion market valuation as a house of cards supported by diminishing consumer confidence.
Furthermore, the concentration of the S&P 500 in a handful of mega-cap technology firms creates a systemic single-point-of-failure risk. If the AI-driven productivity gains do not materialize into actual bottom-line profits by late 2026, the subsequent sell-off will be broad and merciless. We critique the current trend of “dip-buying” as a dangerous psychological bias that ignores the massive $41 trillion discrepancy between market value and economic output.
The lack of institutional hedging against a 2.4 standard deviation event is a failure of fiduciary duty at the highest levels. Most portfolio managers are chasing benchmarks that are fundamentally broken, leading their clients toward a cliff of unprecedented volatility. L-Impact Solutions asserts that the current market structure is optimized for a reality that no longer exists in a high-inflation, high-debt world.
| Related Analysis: Avis 86.2% Short Crisis: Protect Your Capital TSLA $25B Capex Alert: Strengthen Cash Control Plan Intel 20% Surge: Does it Hide $2.5B Foundry Loss? |
Strategic Solutions for Valuation Overextension
The first solution to navigating a 226% Buffett Indicator is the implementation of a “Reverse-Risk Allocation” framework. This involves liquidating positions in sectors where the market-cap-to-revenue ratio exceeds historical norms by more than 50%. By locking in gains now, enterprises can build a significant cash moat that provides the liquidity needed to acquire distressed assets during the crash.
A second vital solution is the transition toward “Value-Based Yield” investments that prioritize dividends and tangible asset backing over speculative growth. Organizations should pivot their treasury management toward short-term U.S. Treasuries and high-grade corporate bonds yielding above 5%. This strategy provides a guaranteed return while the broader equity market faces a projected 20% to 30% downside risk.
Thirdly, firms must conduct a “Sensitivity Audit” on their entire supply chain and customer base to identify vulnerabilities to a sudden credit crunch. This audit should focus on reducing exposure to zombie companies that rely on cheap debt for survival. Strengthening balance sheets by extending debt maturities and cutting non-core operational expenses will ensure resilience when the market reverts to the mean.
Fourthly, we recommend the use of “Tail-Risk Hedging” through sophisticated options strategies like long-dated put spreads. While these hedges carry a carry cost, they act as an insurance policy against the systemic deleveraging that occurs during a Buffett Indicator correction. Investing 1% to 2% of a portfolio in protective derivatives can offset massive losses during a “Black Swan” event.
Finally, businesses must leverage AI not for speculation, but for “Predictive Liquidity Management” to optimize cash flows in real-time. Using advanced algorithms to forecast revenue volatility allows leaders to make data-driven decisions about capital expenditure. In an overvalued market, the most powerful solution is the ability to see the contraction before it hits the general ledger.
Preventative Measures for Future Economic Instability
Prevention of future financial catastrophe begins with the institutionalization of “Valuation-Based Governance” within the corporate board. This means setting hard caps on equity buybacks when the company’s internal Buffett Indicator (market cap to book value) exceeds specific thresholds. By preventing the over-purchase of expensive shares, the company preserves capital for future cycles.
A secondary preventative measure is the diversification of revenue streams into “Anti-Cyclical” markets that perform well during downturns. This could include expanding into essential services, government contracting, or maintenance and repair sectors. A diversified portfolio of business units acts as a natural stabilizer, preventing the entire organization from being dragged down by a stock market crash.
Thirdly, companies should establish “Dynamic Capital Reserves” that automatically increase in size as the Buffett Indicator moves above 150%. This creates a counter-cyclical buffer that forces the organization to save during periods of euphoria and spend during periods of panic. Such a disciplined approach eliminates the emotional trap of buying at the top and selling at the bottom.
Fourthly, regular “Stress-Testing Scenarios” should be integrated into every quarterly strategic review. These tests must simulate a 50% market drawdown, a 10% unemployment spike, and a total freeze of the commercial paper market. Organizations that have already rehearsed their response to these conditions are 40% more likely to survive a systemic crisis.
Lastly, fostering a culture of “Skeptical Optimism” ensures that leadership teams do not succumb to the herd mentality of the bull market. Encouraging internal analysts to present “Bear Case” scenarios without fear of retribution creates a more balanced view of risk. Prevention is ultimately a mindset that values long-term sustainability over short-term stock price appreciation.
L-Impact Solutions Key Takeaway
The current 226% Buffett Indicator is a loud, numerical signal that the era of easy money has reached its ultimate breaking point. You cannot outrun the math of a $41 trillion valuation gap without facing a severe correction. L-Impact Solutions believes that the winners of the next decade will be those who have the courage to step away from the fire today. Do not let the “FOMO” of the final rally cloud your judgment of the clear economic data. The Oracle is nervous for a reason, and it is time for your organization to prioritize survival over speculation.
FAQs:
Is the 226.40% Buffett Indicator signaling a major U.S. stock market crash risk in 2026?
A 226.40% reading suggests valuations are historically stretched, but relying on one indicator alone is risky, so investors should combine it with earnings, rates, and liquidity data before making drastic moves.
Can a $73.3 trillion market cap vs $32.38 trillion GDP gap sustain higher S&P 500 prices?
Such a wide valuation gap raises legitimate concerns, yet markets can remain expensive for long periods, making disciplined risk management smarter than panic selling.
Will a 30% to 50% correction happen after the Buffett Indicator crossed 200%?
A sharp correction is possible when valuations overextend, but calling a guaranteed 30% to 50% drop oversimplifies market behavior and ignores timing uncertainty.
How should investors protect portfolios when GDP growth slows to 0.5% and valuations stay elevated?
When growth weakens and valuations stay rich, gradually increasing diversification, cash reserves, and quality assets is usually more effective than emotional all-or-nothing moves.
Are AI-driven stocks creating a 1999 tech bubble repeat despite 122% debt-to-GDP levels?
AI enthusiasm may be inflating selective sectors, but comparing everything to 1999 can miss real innovation, so investors should separate profitable leaders from pure hype.
Reference – According to Warren Buffett’s math the stock market is officially in ‘playing with fire’ territory.